U.S. Social Stratification
Provided by Inequality.org
Facts
and Figures
Part 1: Wealth Patterns
1.1
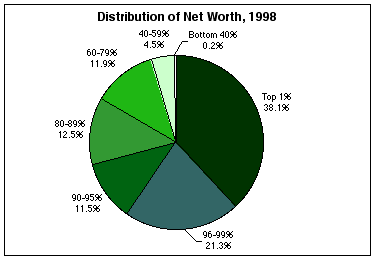
Distribution of Net Worth
|
Wealth Class |
1983 |
1989 |
1992 |
1995 |
1998 |
|
Top 1% |
33.8 |
37.4 |
37.2 |
38.5 |
38.1 |
|
Next 4% |
22.3 |
21.6 |
22.8 |
21.8 |
21.3 |
|
Next 5% |
12.1 |
11.6 |
11.8 |
11.5 |
11.5 |
|
Next 10% |
13.1 |
13.0 |
12.0 |
12.1 |
12.5 |
|
Next 20% |
12.6 |
12.3 |
11.5 |
11.4 |
11.9 |
|
Middle 20% |
5.2 |
4.8 |
4.4 |
4.5 |
4.5 |
|
Bottom 40% |
0.9 |
-0.7 |
0.4 |
0.2 |
0.2 |
Source: Edward N. Wolff, "Recent Trends
in Wealth Ownership, 1983-1998," April 2000. Table 2. Available
on the website of the Jerome Levy Economics Institute at www.levy.org/docs/wrkpap/papers/300.html.
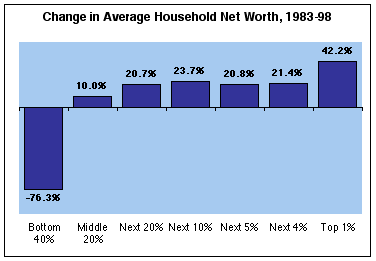
1.2 Change in Average Household
Net Worth by Wealth Class
Source:
Edward
N. Wolff, "Recent Trends in Wealth Ownership, 1983-1998," April
2000. Table 3. http://www.levy.org/docs/wrkpap/papers/300.html
1.3 Household Net Worth by Wealth Class, 1998
|
Wealth Class |
Average Net Worth |
Threshold |
|
Top 1% |
$10,204,00 |
$3,352,100 |
|
Next 4% |
$1,441,000 |
|
|
Next 5% |
$623,500 |
$475,600 |
|
Next 10% |
$344,900 |
$257,700 |
|
Fourth 20% |
$161,300 |
|
|
Middle 20% |
$61,000 |
|
|
Bottom 40% |
$1,900 |
(Negative) |
Source: Edward N. Wolff, "Recent Trends in Wealth Ownership, 1983-1998," April 2000. Table 3 and note to Table 5. http://www.levy.org/docs/wrkpap/papers/300.html
1.4 Top 1% Share of Household Wealth
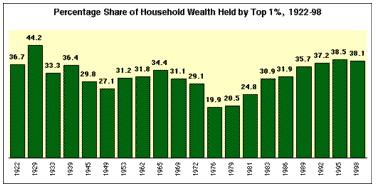
Source:
Edward
Wolff, Top Heavy, 1996, New
Series Households data, pp. 78-79 (for years 1922-89) and "Recent
Trends in Wealth Ownership," April 2000, Table 2 (for years 1992-98)
http://www.levy.org/docs/wrkpap/papers/300.html
1.5 Share of Total Ownership of Stocks, Mutual Funds, and Retirement Accounts,
1998
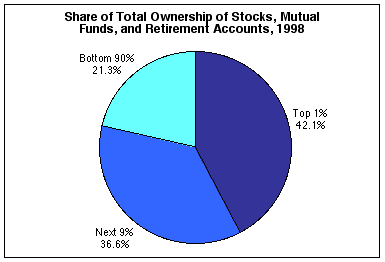
Source:
Edward
N. Wolff, "Recent Trends in Wealth Ownership, 1983-1998,"
April 2000. Table 6. http://www.levy.org/docs/wrkpap/papers/300.html
1.6 The Racial Wealth Gap, 1983-98
|
|
1983 |
1989 |
1992 |
1995 |
1998 |
|
Median Net Worth |
|
|
|
|
|
|
White |
$71,500 |
$84,900 |
$71,300 |
$65,200 |
$81,700 |
|
African-American |
$4,800 |
$2,200 |
$12,000 |
$7,900 |
$10,000 |
|
Hispanic |
$2,800 |
$1,800 |
$4,300 |
$5,300 |
$3,000 |
|
|
|
|
|
|
|
|
Median |
|
|
|
|
|
|
White |
$19,900 |
$26,900 |
$21,900 |
$19,300 |
$37,600 |
|
African-American |
$0 |
$0 |
$200 |
$200 |
$1,200 |
|
Hispanic |
$0 |
$0 |
$0 |
$0 |
$0 |
|
|
|
|
|
|
|
|
Homeownership
Rate |
|
|
|
|
|
|
White |
68.1% |
69.3% |
69.0% |
69.4% |
71.8% |
|
African-American |
44.3% |
41.7% |
48.5% |
46.8% |
46.3% |
|
Hispanic |
32.6% |
39.8% |
43.1% |
44.4% |
44.2% |
Note:
Financial Wealth is Net Worth minus the value of owner-occupied housing.
Source:
Edward N. Wolff, "Recent Trends in Wealth Ownership, 1983-1998,"
April 2000. Tables 8 and 9. http://www.levy.org/docs/wrkpap/papers/300.html
Factoids
- In 2001, 16.3 percent of American children lived in poverty, a lower rate than 1993 (22.7 percent), but higher than the 1973 rate of 14.4 percent. (U.S Census Bureau Current Population Survey: http://www.census.gov/hhes/poverty/histpov/hstpov3.html/)
-
Nearly one quarter of all workers – more than 28 million in all -- earn less than $8.78 an hour, the amount needed to lift a family of four above the poverty line with full-time work (about $18,200 a year). (Economic Policy Institute, The State of Working America 2002-03, p. 355)
-
In 1998, the top 1 percent of Americans owned 47.7 percent of all stock, while the bottom 80 percent owned 4.1 percent. Between 1989 and 1998, nearly 35 percent of all stock market gains went to the top 1 percent of shareholders. 64 percent of American households have stock holdings worth $5,000 or less, or own no stock at all. (NYU Economist Edward N. Wolff, cited by Economic Policy Institute, The State of Working America 2002-03, pp. 286-289)
-
Between 1995 and 1998, the total wealth of the typical American household rose from $58,800 to $61,000. The average value of stock holdings rose $5,500, the value of non-stock assets (mostly homes) climbed $8,500, and household debt increased $11,800. (Economic Policy Institute)
-
Middle-class families enjoyed 2.8 percent of the stock market gains between 1989 and 1998, but accounted for 38.8 percent of the increase in household debt. (Economic Policy Institute)
-
In 2000, 63.4 percent of private sector workers had employer-provided healthcare, down from 70.2 percent in 1979. 49.6 percent of private sector workers have employer-provided pension plans. (Economic Policy Institute, The State of Working America 2002-03, pp. 142-143)
-
60 percent of U.S. workers say that if they were laid off, their savings are sufficient to maintain their current standard of living for a few months or less. Only 29 percent said they are able to save for the future. 40 percent say they earn enough to be comfortable, but not to save, while 27 percent said they earn only enough to get by, and 3 percent said they are unable to pay their bills. (Fleet Bank, contact Rena DeSisto, 212-703-1961)
-
64 percent of U.S. workers say they would rather have more time than more money. Even in households earning less than $25,000, 49 percent said they would still prefer time over money. (Fleet Bank)
- As
of 1998, the richest five percent of U.S. households held more than 59
percent of the nation's private wealth. The top 1 percent of
households held 38 percent of the wealth. (NYU Economist Edward N. Wolff, cited
by Economic Policy Institute, The State of Working America 2002-03,
p. 281)
- Between
1983 and 1998, households in the bottom 20 percent of the population
saw their net worths decline from -$3,200 to -$8,900 in 1998 dollars.
Meanwhile, the net worth of the middle fifth of the population rose
3.7 percent, and the net worth of the top 1 percent rose 30%. (NYU
Economist Edward N. Wolff, cited by Economic Policy Institute, The State
of Working America 2002-03, p. 281)
- In 1998,
the typical black household held only 12 percent of the wealth of the
typical white household. With housing excluded, that figure would be 3
percent. More than 27 percent of black households (and nearly15
percent of white households) have no net worth. (NYU Economist Edward N.
Wolff, cited by Economic Policy Institute, The State of Working America
2002-03, p. 284)
- Most
Americans in the highest-earning one percent of the population (median
annual income: $330,000) don't consider themselves rich. (Worth-Roper
Starch Survey)
- As of 1998, 48 percent of American households owned stock either directly or through a mutual fund or some sort of retirement plan. Over 86 percent of the value of all stocks and mutual funds, including pensions was held by the top 10 percent of the households. (Economic Policy Institute, The State of Working America 2002-03, pp. 286-87)
Part 2: Income Patterns
2.1 Change in Family Income, 1947-79 and 1979-98
| Bottom 20% | Second 20% | Middle 20% | Fourth 20% | Top 20% | Top 5% | |
| 1979 Income Range | up to $9,861 | $9,861 - $16,215 | $16,215 - $22,972 | $22,972 - $31,632 | $31,632 and up | $50,746 and up |
| 1947-79 Income Change | +116% | +100% | +111% | +114% | +99% | +86% |
| 2001 Income Range | up to $24,000 | $24,000 - $41,127 | $41,127 - $62,500 | $62,500 - $94,150 | $94,150 and up | $164,104 and up |
| 1979-99 Income Change | +3% | +11% | +17% | +26% | +53% | +81% |
Sources: 1947-79: Analysis of U.S. Census Bureau data in Economic Policy Institute, The State of Working America 1994-95, p. 37. 1979-2001: U.S. Census Bureau, Historical Income Tables, Table F-3: http://www.census.gov/hhes/income/histinc/f03.html. Thresholds: U.S. Census Bureau, Historical Income Tables, Table F-1: http://www.census.gov/hhes/income/histinc/f01.html.
2.2 Change in After-Tax Family Income, 1979-97
| Bottom 20% | Second 20% | Middle 20% | Fourth 20% | Top 20% | Top 10% | Top 5% | Top 1% | |
| 1979 Income |
$10,900
|
$23,300
|
$33,800
|
$44,700
|
$79,100
|
$101,200
|
$132,600
|
$263,700
|
| 1997 Income |
$10,800
|
$24,700
|
$37,200
|
$52,200
|
$121,000
|
$169,900
|
$245,900
|
$677,900
|
| Change |
-1%
|
+6%
|
+10%
|
+17%
|
+53%
|
+68%
|
+85%
|
+157%
|
2.3 CEO Pay as a
Multiple of Average Worker Pay, 1960-99
| 1960 | 1970 | 1980 | 1990 | 1995 | 1996 | 1997 | 1998 | 1999 | 2000 | 2001 |
| 41 | 79 | 42 | 85 | 141 | 209 | 326 | 419 | 475 | 531 | 411 |
2.4 Increase
in CEO Pay, Worker Pay, and Inflation, 1990-99
| CEO Pay | +463% |
| Worker Pay | +42% |
| Inflation | +36% |
- Forty-seven million households in the United States have annual incomes below $35,000, and in the event of a layoff or a medical crisis, 40 percent of American families would run out of cash within three days. (New York Times)
- If pay for production workers had grown as fast as pay for chief executives, factory workers would be making an average of $101,156 a year (instead of $25,467) and the minimum wage would be $21.41 (instead of $5.15). (United for a Fair Economy and Institute for Policy Studies, Executive Excess 2002: http://www.FairEconomy.org/press/2002/EE2002_pr.html)
- Income inequality declined from the late 1930s through the '60s. In the 1920s, the richest five percent of American families received about 30 percent of the nation's personal income. That share had decreased to 17.5 percent of income by 1947, and to 15.6 percent by 1969, according to the Census Bureau (whose figures underestimate high incomes by, among other things, excluding capital gains). After a brief period of stability, inequality began widening in the late '70s. The income share going to the richest five percent of families reached 17.9 percent in 1989, 21.0 percent in 2001. The richest one-half of 1 percent of American taxpayers now account for more than 11 percent of aggregate income. In recent years, only college graduates, about a quarter of the work force, have racked up significant wage gains. (Frank Levy, "The New Dollars and Dreams: American Incomes and Economic Change" Income share data for 2001 from U.S. Census Bureau: http://www.census.gov/hhes/income/histinc/f02.html)
-
After a period of stagnation, workers saw more benefits from the strong economy in the late 1990s. Between 1995 and 2000, average hourly wages rose 2.7 percent per year, compared to 0.6 percent per year between 1989 and 1995. In the more recent period, real wages at the10th percentile of workers rose 11.0 percent, beating the 10.6 percent gain by workers at the 95th percentile. However, since 1979, the top group has seen a 28.8 percent increase in real wages, while the bottom group's wages have risen only 0.2 percent. (Economic Policy Institute, The State of Working America 2002-03, pp. 118, 126)
- From 1995-2001:
Real income for bottom-quintile families rose 7.9 percent.
Real income for middle-quintie families rose 9.9 percent.
Real income for top 5% families rose 18.6 percent.
(U.S. Census Bureau, Current Population Survey: http://www.census.gov/hhes/income/histinc/f03.html)
-
Between 1989 and 2000, the typical married couple's income rose 13.9 percent. However, families had to work an additional 186 hours per year (4.65 work weeks), for a total of 3,719 hours. The average African-American family worked 3,800 hours per year, an increase of more than 200 hours since 1989. In those same years, poverty rates fell faster for Hispanics (4.9 percentage points) and African-Americans (8.7 percentage points) than they did for whites (0.9 percentage points). Yet, minorities continue to have much higher overall poverty rates: African-Americans, 19.1 percent; Hispanics, 18.5 percent; Whites, 6.9 percent. (Economic Policy Institute, The State of Working America 2002-03, pp. 97,99, 318)
-
Often, practical challenges prevent the unemployed from taking work. In Cleveland, 80 percent of welfare recipients live in the central city, but 80 percent of entry-level jobs are located in the suburbs. In Boston, 43 percent of entry-level jobs are not accessible by public transportation. (The Brookings Institution, Center on Urban and Metropolitan Policy. "Why Cities Matter to Welfare Reform.")
- Between
1973 and 2001, while the earnings of college graduates rose 16%, the
inflation-adjusted earnings of male high school graduates with no college
fell 11%. (Economic Policy Institute, The State of Working America
2002-03, pp. 157-158)
- In 1979,
the combined after-tax income of the highest-earning 20 percent of American
families was 7.7 times that of the bottom 20 percent. In 2000, the multiple
was 10.1, representing a 30% increase in inequality between 1979 and
2000. (Economic Policy Institute, The State of Working America 2002-03,
p. 67)
- In 2001,
the average American production worker's inflation-adjusted weekly wages
were 5 percent below what they had been in 1973. (Economic Policy
Institute, The State of Working America 2002-03, p. 121)
- In 1979,
the average male college graduate earned about a third more than the
median high school graduate; by 2001, the gap had widened to 79 percent.
(Economic Policy Institute, The State of Working America 2002-03,
p. 121)
- In 1947,
children were slightly less likely than adults to be poor. Now the reverse
is true. (Frank Levy) The official poverty rate among children is about
sixteen percent. Among adults, it's twelve percent. (U.S. Census
Bureau: 2001 Current Population Survey: http://ferret.bls.census.gov/macro/032002/pov/new01_001.htm)
- With the
value of cashed-in stock options factored in, the average CEO of a major
U.S. corporation made $11 million in 2001, down from $13.1 million in
2000. (Business Week, 4/15/02)
- The average
CEO makes 1,027 times more than a minimum wage worker. If the minimum
wage had risen at the same rate as executive pay since 1990, it would
stand at $21.41 an hour as opposed to $5.15. (United for a Fair Economy
and Institute for Policy Studies, Executive Excess 2002: http://www.FairEconomy.org/press/2002/EE2002_pr.html)
- As a result
of the merger between Chrysler and Daimler Benz, Chrysler chairman Robert
Eaton will get $69.9 million in cash and stocks, and options worth another
$239 million. In 1997, Daimler chairman Juergen Schrempp took home $2.5
million, while Eaton made $16 million, though Schrempp ran a larger
and more profitable company. (United for a Fair Economy)
- The average
wage of a Silicon Valley software engineer was $95,800 in 1998, the
most recent year for which the data is available. In the largest of
all employment categories, "local and visitor services" (including retail
and restaurant workers), the average wage was $22,9000. (The New York
Times, Jan. 10, 2000).
Health Patterns
- 33 million Americans – including 13 million children - regularly go hungry or can't afford balanced meals. The number is down 2.9 million since 1998. (Food Research Action Center, citing US Department of Agriculture: http://www.frac.org/html/news/press031302.htm)
Infant Mortality
- Seven
American infants die for every 1,000 who are born. The infant mortality
rate for whites is 5.7 per 1,000 live births. The infant mortality rate
for African-Americans is more than twice as high: 14.1 deaths per 1,000
live births. (National Center for Health Statistics: http://www.cdc.gov/nchs/fastats/infmort.htm)
- In 1960, the United States ranked 12th in lowest rate of infant mortality. In 1998, the U.S. ranked 28th. (National Center for Health Statistics, Health, United States, 2002: http://www.cdc.gov/nchs/products/pubs/pubd/hus/02hustop.htm table 26)
- The United
States spends more on medical care--13.1 percent of gross domestic product--than
any other advanced industrialized society. (National Center for Health
Statistics, Health, United States, 2002: http://www.cdc.gov/nchs/products/pubs/pubd/hus/02hustop.htm
table 112)
Yet among the 30 OECD nations, we rank 18th in female life expectancy and 19th in male life expectancy. (OECD: www.oecd.org/xls/M00031000/M00031357.xls) The average life expectancy for white Americans is 77.3 years. For black Americans, it stands at 71.4 years (National Center for Health Statistics, Health, United States, 2002: http://www.cdc.gov/nchs/products/pubs/pubd/hus/02hustop.htm table 28)
- Death rates in the most economically divided metropolitan areas--such as Pine Bluff, Ark., an Mobile, Ala.--are sharply higher than the national annual average of 850 deaths per 100,000 people. The increase in mortality--an extra 140 deaths per 100,000 people--is equivalent to the combined loss of life from lung cancer, diabetes, motor vehicle accidents, HIV, infection, suicide and homicide during 1995. (Lynch J.W., Kaplan G.A., Pamuk E.R., et al. "Income inequality and mortality in metropolitan areas of the United States," American Journal of Public Health 1998)
- The Japanese, well-known for the relatively small gap between the earnings of their top executives and ordinary workers, are the world's longest-lived people. Japanese men, who are twice as likely to smoke as American men, not only live longer but, remarkably, have lower rates of lung cancer. The 3.6-year gap in life expectancy between the United States and Japan (76.2 and 79.8 years, respectively) is equal to the gain we would realize if heart attacks vanished as a cause of death. (Washington Post, 8/16/98)
- Roughly forty-one million Americans--one seventh of the population--have no health insurance. In 1990, the figure was 35 million. About 8.5 million children are uninsured. (U.S. Census Bureau: http://www.census.gov/hhes/hlthins/historic/hihistt1.html and http://www.census.gov/hhes/hlthins/historic/hihistt2.html)
- Eighteen percent of workers between 18 and 64 were uninsured in 1997--an increase of 15.7 percent over 1990. Sixty-nine percent of white workers were covered by employer-sponsored insurance, compared with 52 percent of African American workers and 44 percent of Latino workers. (Sacramento Bee)
- One in four American workers has no access to employment-based health insurance coverage at any price. (General Accounting Office, Feb 1997, Employment-Based Health Insurance Costs)
- About ten million children are uninsured. In 1996, 70 percent of all Americans added to the ranks of the uninsured were children. (Census Bureau)